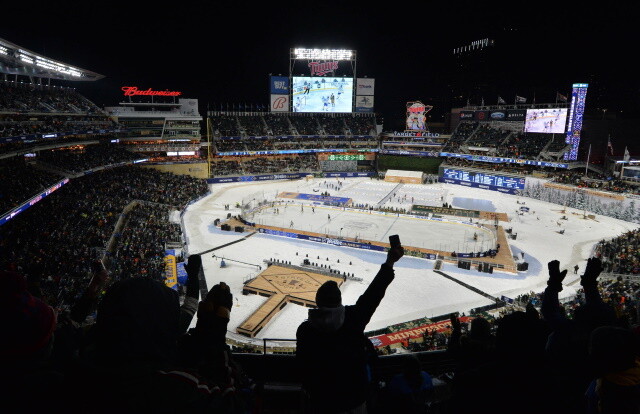
We’re back with our third installment of tracking NHL attendance this season. Canadian teams are now back to 100 percent capacity but some numbers at the 30 games took a hit due to the provincial restrictions.
Seven teams are running at 100 percent capacity or higher, though that number is aided by outdoor games in Nashville and Minnesota.
Twelve teams are over 95 percent, with fifteen teams over 90 percent.
Five teams are under 70 percent with Sabres and Senators being under 50.
| AVG 30 GMs | % Cap | AVG 20 GMs | AVG 10 GMS | 2019-20 GMs | 2019-20 AVG | 2019-20 % Cap |
|
|---|---|---|---|---|---|---|---|
| Tampa Bay | 19092 | 100 | 19092 | 19092 | 34 | 18922 | 99.9 |
| Nashville | 18937 | 100.5 | 17116 | 17084 | 35 | 17407 | 101.7 |
| Washington | 18573 | 100.4 | 18573 | 18573 | 33 | 18570 | 100.4 |
| Minnesota | 18466 | 102.9 | 18571 | 16864 | 35 | 17472 | 97.3 |
| Chicago | 18294 | 92.8 | 18023 | 18296 | 34 | 21441 | 108.7 |
| Vegas | 18082 | 104.1 | 18045 | 18034 | 37 | 18310 | 105.4 |
| Boston | 17850 | 1000 | 17850 | 17850 | 35 | 17681 | 100.7 |
| Dallas | 17779 | 95.9 | 18009 | 18078 | 34 | 20326 | 113 |
| St. Louis | 17608 | 97.3 | 17365 | 17424 | 35 | 18096 | 100 |
| Pittsburgh | 17565 | 96.6 | 17240 | 16897 | 35 | 18537 | 100.8 |
| Colorado | 17318 | 96.2 | 17243 | 17346 | 33 | 18708 | 107.1 |
| Carolina | 17278 | 92.5 | 16899 | 16933 | 33 | 16905 | 90.5 |
| Seattle | 17151 | 100.3 | 17151 | 17151 | - | - | - |
| NY Islanders | 17008 | 99.4 | 17168 | 17255 | 35 | 12810 | 81.3 |
| Detroit | 16996 | 87.1 | 17073 | 16681 | 37 | 18716 | 95.9 |
| Vancouver | 16740 | 88.5 | 16686 | 18544 | 35 | 18679 | 98.8 |
| NY Rangers | 16631 | 12.4 | 16386 | 15827 | 36 | 17206 | 95.6 |
| Philadelphia | 16572 | 84.8 | 17230 | 17648 | 35 | 18390 | 94.4 |
| Columbus | 15935 | 87.8 | 16046 | 15540 | 36 | 16898 | 93.1 |
| Los Angeles | 14642 | 80.3 | 13319 | 13698 | 34 | 16916 | 92.8 |
| Toronto | 14555 | 77.3 | 16045 | 18682 | 34 | 19301 | 102.6 |
| Florida | 14205 | 83.4 | 13610 | 13112 | 35 | 14104 | 82.8 |
| Edmonton | 14132 | 75.8 | 14744 | 16061 | 34 | 17533 | 94.1 |
| Montreal | 13497 | 63.5 | 14943 | 19686 | 37 | 21085 | 99.1 |
| Calgary | 13325 | 69.1 | 12326 | 15383 | 33 | 18751 | 97.2 |
| Anaheim | 12938 | 75.3 | 12948 | 12661 | 36 | 15846 | 92.3 |
| New Jersey | 12610 | 76.4 | 12924 | 13244 | 34 | 14899 | 90.2 |
| San Jose | 12342 | 70.3 | 12113 | 12498 | 36 | 16427 | 93.5 |
| Wininpeg | 12275 | 81.8 | 12103 | 13731 | 37 | 15794 | 108.2 |
| Arizona | 11509 | 67.2 | 11646 | 12205 | 33 | 14605 | 85.3 |
| Buffalo | 8822 | 46.3 | 8635 | 7910 | 35 | 17167 | 90.7 |
| Ottawa | 7282 | 38 | 8132.05 | 11352 | 37 | 12618 | 65.9 |


