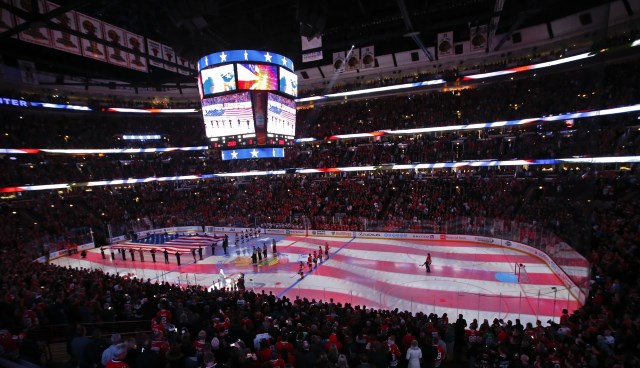
We are once again tracking NHL attendance at various points of the season. First up is home attendance at the 10 game mark. Also listed are attendance numbers from the past three seasons at a similar time in the season
We’ll continue to track and have updates after 20 and 30 games.
After 10 games, there are 14 teams that are running above 100 percent capacity. Last season saw 13 teams as well at over 100 percent capacity at the 10 game mark.
18 teams are at 95 percent or more capacity, down from 21 last year, though three teams are less than one percent away from 95.
Six teams are under 80 percent, two teams under 70 percent, and one under 60 percent.
| Rank | Team | Average | Capacity % | 2014-15 10 Games | 2013-14 10 Games | 2012-13 12 Games |
|---|---|---|---|---|---|---|
| 1 | Chicago | 21,638 | 109.7 | 21,439 | 21,414 | 21,576 |
| 2 | Montreal | 21,288 | 100.1 | 21,287 | 21,273 | 21,273 |
| 3 | Detroit | 20,027 | 100 | 20,027 | 20,066 | 20,066 |
| 4 | Toronto | 19,309 | 102.6 | 19,163 | 19,409 | 19,370 |
| 5 | Calgary | 19,111 | 99.1 | 19,045 | 19,289 | 19,289 |
| 6 | Tampa Bay | 19,092 | 100 | 18,585 | 18,167 | 19,204 |
| 7 | Minnesota | 19,003 | 105.8 | 18,894 | 17,985 | 18,549 |
| 8 | Pittsburgh | 18,512 | 100.7 | 18,638 | 18,595 | 18,645 |
| 9 | Washington | 18,506 | 100 | 18,506 | 18,506 | 18,506 |
| 10 | Vancouver | 18,393 | 97.3 | 18,645 | 18,910 | 18,985 |
| 11 | St. Louis | 18,380 | 96 | 17,472 | 16,644 | 17,644 |
| 12 | Los Angeles | 18,230 | 100 | 18,258 | 18,118 | 18,183 |
| 13 | Buffalo | 18,070 | 94.8 | 18,243 | 18,372 | 18,973 |
| 14 | Dallas | 18,030 | 97.3 | 16,841 | 15,703 | 17,347 |
| 15 | NY Rangers | 18,006 | 100 | 18,006 | 18,006 | 17,200 |
| 16 | Ottawa | 17,625 | 92 | 18,269 | 17,739 | 19,001 |
| 17 | Boston | 17,565 | 100 | 17,565 | 17,565 | 17,565 |
| 18 | Philadelphia | 17,274 | 88.4 | 19,771 | 19,961 | 19,770 |
| 19 | Nashville | 17,126 | 100.1 | 16,853 | 16,605 | 17,144 |
| 20 | Edmonton | 16,839 | 100 | 16,839 | 16,794 | 16,839 |
| 21 | San Jose | 16,537 | 94.2 | 17,411 | 17,562 | 17,560 |
| 22 | Anaheim | 16,246 | 94.6 | 16,459 | 15,389 | 15,560 |
| 23 | Colorado | 16,218 | 90.1 | 15,439 | 16,335 | 15,257 |
| 24 | Winnipeg | 15,294 | 101.9 | 15,016 | 15,004 | 15,004 |
| 25 | Columbus | 14,086 | 77.6 | 15,708 | 14,269 | 13,648 |
| 26 | New Jersey | 13,601 | 77.2 | 14,897 | 14,180 | 17,190 |
| 27 | Arizona | 12,937 | 75.5 | 13,062 | 12,414 | 13,182 |
| 28 | NY Islanders | 12,188 | 77.1 | 13,608 | 12,842 | 12,818 |
| 29 | Florida | 11,547 | 67.8 | 8,981 | 13,832 | 17,003 |
| 30 | Carolina | 11,137 | 59.6 | 11,962 | 15,440 | 18,026 |
** NHL attendance figures were taken from ESPN.


