Here is our second installment looking at NHL attendance figures for this season. A look at each teams home attendance through 20 games, along with the arena capacity percentage.
We’ve also included the average attendance at the 10 game mark for this season, as well as the 20 game average for past three seasons.
The Chicago Blackhawks are once again averaging the highest NHL attendance at home.
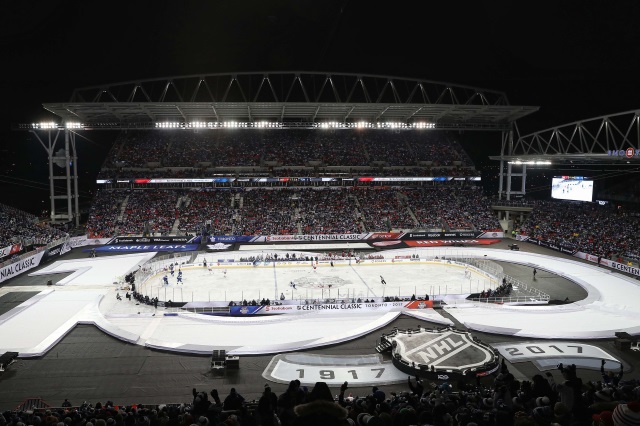
Numbers for the Toronto Maple Leafs and Winnipeg Jets are skewed due to hosting outdoor games. The St. Louis Blues hit the 20 game market before the Winter Classic, so their numbers will jump in our next update at the 30 game mark.
15 teams are tracking at 100 percent capacity or higher, with 21 teams at higher than 95 percent.
Eight teams are at under 90 percent, with the New Jersey Devils just under the mark at 89.9 percent.
Seven teams are under 84 percent capacity, and four teams are under 80 percent.
The Carolina Hurricanes are averaging over 750 more than at the 10 game mark, but are at a league low 62.8 percent capacity.
Teams seeing a decrease in average attendance from the 10 game mark to the 20 game mark include the Arizona Coyotes, Colorado Avalanche, Winnipeg Jets (due to outdoor game), Nashville Predators, New York Rangers, Los Angeles Kings, Dallas Stars, and Chicago Blackhawks.
| Team | 2016-17 20 GMs | Capacity | 2016-17 10 GMs | 2015-16 20 GMs | 2014-15 20 GMs | 2013-14 20 GMs |
|---|---|---|---|---|---|---|
| Chicago | 21,593 | 109.5 | 21,595 | 21,689 | 21,626 | 21,459 |
| Montreal | 21,288 | 100.1 | 21,288 | 21,288 | 21,286 | 21,273 |
| Toronto | 20,211 | 113.1 | 19,239 | 19,306 | 19,143 | 19,353 |
| Detroit | 20,027 | 100 | 20,027 | 20,027 | 20,027 | 20,066 |
| Philadelphia | 19,564 | 100.1 | 19,550 | 19,075 | 19,732 | 19,778 |
| Pittsburgh | 19,174 | 101.9 | 18,521 | 18,550 | 18,605 | 18,591 |
| Tampa Bay | 19,092 | 100 | 19,092 | 19,092 | 18,576 | 18,367 |
| Minnesota | 18,987 | 105.8 | 18,982 | 19,027 | 18,962 | 18,190 |
| Calgary | 18,560 | 96.2 | 18,500 | 19,145 | 19,021 | 19,289 |
| Washington | 18,506 | 100 | 18,506 | 18,506 | 19,722 | 18,506 |
| Buffalo | 18,454 | 96.8 | 18,239 | 18,286 | 18,136 | 18,392 |
| St. Louis | 18,444 | 96.3 | 18,273 | 17,803 | 17,951 | 16,695 |
| Vancouver | 18,347 | 97 | 18,205 | 18,403 | 18,719 | 18,910 |
| Edmonton | 18,347 | 100 | 18,347 | 16,839 | 16,839 | 16,816 |
| Dallas | 18,301 | 98.8 | 18,386 | 18,248 | 17,062 | 14,259 |
| Los Angeles | 18,251 | 100.1 | 18,252 | 18,264 | 18,267 | 18,125 |
| NY Rangers | 18,035 | 100.2 | 18,064 | 18,006 | 18,006 | 18,006 |
| Boston | 17,565 | 100 | 17,565 | 17,565 | 17,565 | 17,565 |
| San Jose | 17,508 | 99.7 | 17,495 | 16,730 | 17,394 | 17,562 |
| Nashville | 17,150 | 100.2 | 17,170 | 16,869 | 16,809 | 16,489 |
| Winnipeg | 16,191 | 113.6 | 17,089 | 15,294 | 15,016 | 15,004 |
| Anaheim | 16,060 | 93.5 | 15,892 | 16,178 | 16,635 | 16,059 |
| Ottawa | 15,666 | 81.8 | 15,069 | 17,803 | 18,272 | 17,375 |
| Colorado | 15,071 | 83.7 | 15,422 | 16,341 | 15,838 | 16,236 |
| Columbus | 14,898 | 82.1 | 13,743 | 13,652 | 15,570 | 13,608 |
| New Jersey | 14,851 | 89.9 | 14,394 | 14,357 | 15,297 | 14,544 |
| Florida | 14,615 | 75.9 | 14,091 | 13,963 | 10,699 | 14,586 |
| Arizona | 12,923 | 75.5 | 13,084 | 13,266 | 12,999 | 13,006 |
| NY Islanders | 12,583 | 79.6 | 12,390 | 12,923 | 14,637 | 13,533 |
| Carolina | 11,736 | 62.8 | 10,969 | 11,153 | 12,456 | 15,351 |
* NHL attendance figures were taken from ESPN.
